Weekly Economic Update

Economic Update 8-31-2015

  • From a domestic standpoint, economic data last week was decent, with durable goods orders stronger than expected, decent housing gains and a sharply-revised second-quarter GDP number.  Much of the economic concerns continued to reside abroad, namely in China.
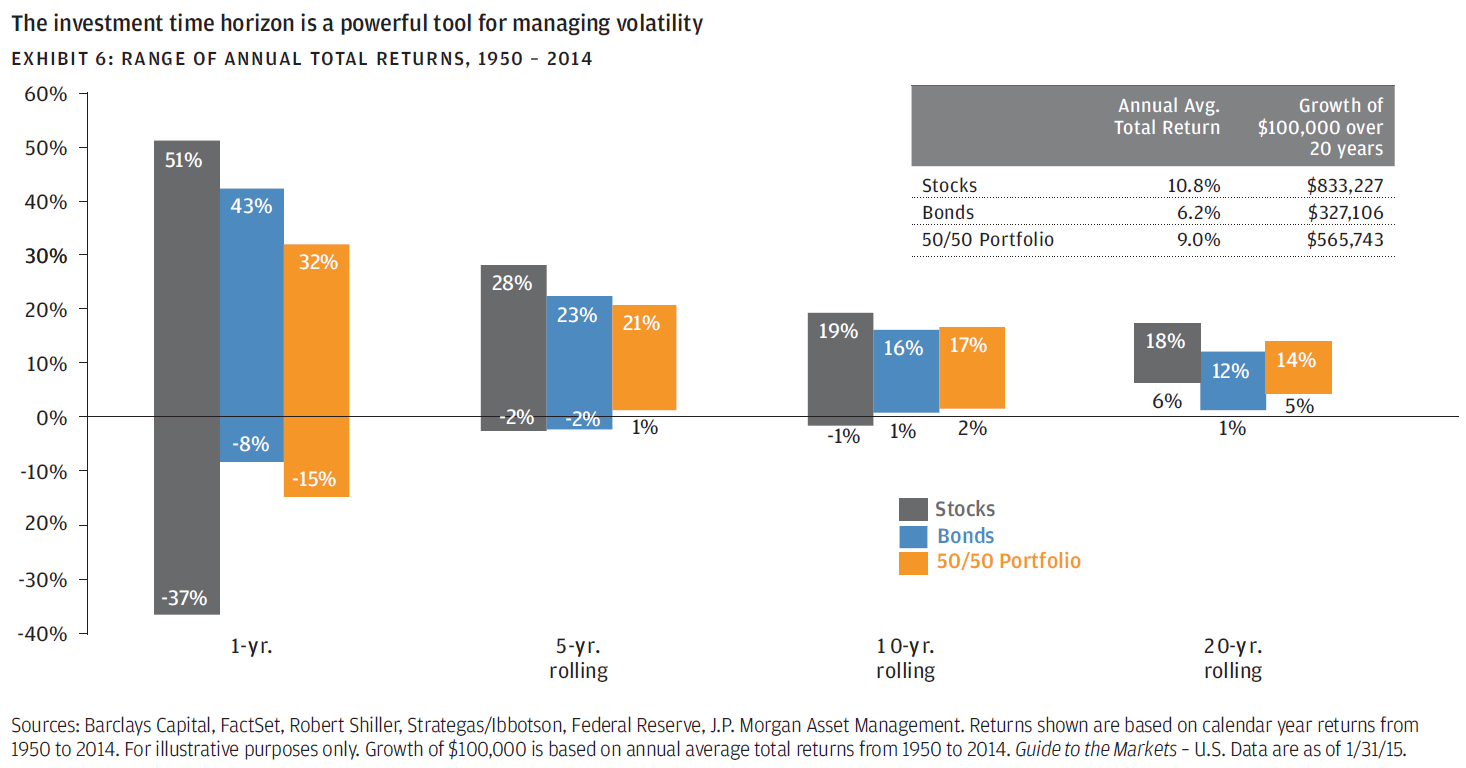
  • Market experienced one of their more volatile showings in years, with an early-week drawdown followed by a sharp recovery by Friday—U.S. stocks ended higher while foreign stocks were mixed. Along similar lines, bond yields plummeted early in risk-off trading before recovering higher later in the week, resulting in negative performance for many investment-grade bond indexes.

Continue reading

Posted in Economic News | Tagged , , , , , , , , , , , , , , , , , , , , , , , , , , , , , , , , , , , , , , , , , | Leave a comment

Chart of the Week: Your Client’s Investment Horizon

Investment horizon

Click image to enlarge

After shedding more than 1,000 points last week, the Dow Jones opened up Monday free-falling another 1,089, spreading panic throughout markets. These kinds of corrections cannot be predicted, however they are inevitable. The last time the market corrected (defined by losing 10% from peak to trough) was over 1,000 days ago, a streak that has only occurred 2 other times in history. On average, the market corrects itself every 357 days, or about once a year1. The important thing for advisors to remember is to maintain perspective of your clients’ investment horizon. The chart above is from a piece from JP Morgan’s James C. Liu. It shows the range of annual total returns for stocks, bonds, and a 50/50 portfolio over investment horizons of 1 year, 5 year, 10 year, and 20 year. As the chart shows, expanding the holding period just 5 years dramatically improves the risk/return each asset class, not to mention there has never been a 5 year period in the post-war era where a 50/50 portfolio experienced losses.

Posted in Research | Tagged , , , , , , , , , | Leave a comment

Special Market Commentary: Is Correction Our Direction?

SPECIAL MARKET COMMENTARY

August 24, 2015

Is Correction Our Direction?

Not even a week ago I started to write an article for our clients that I was going to title, “Is Flat The New Up?”  I was basing this article on the fact that as of last Tuesday (August 19th) the S&P 500 stock market index was up slightly over 1% for 2015.  A puny return when compared to the returns of previous markets for the same time frame.  The 500 hit its highest mark on May 21, 2015 when it peaked at +3.4%.   My original thought was, “Is this what it’s going to be like for the rest of the year?”  So is flat the new up?  We have been sharing with clients since last fall of our belief that the U.S. stock market might be considered fully valued.  That means that on a price to earnings valuation some believe it would be perhaps more difficult for stocks to grow at the same pace as the prior three years.  After all we are six and a half years into this bull market which is the third longest in stock market history.  But when considering the reasonable growth rate of the U.S. economy why wouldn’t stocks be able to continue to grow modestly in 2015?  So our statement to clients has been that we believed that the 500 in 2015 potentially could grow at a pace between 6% to 8%.  We also stated that most of this year’s growth potential would occur in the second half of 2015, not the first.   The reason?  Because our last two winters (2013/2014) have been so severe that business that would typically consummate in the first quarter would be pushed into the second quarter GDP numbers and then continue to improve and stabilize through the end of the year.  But just as I was about to wrap up our thoughts on “Is Flat The New Up?” stock markets around the globe fell at the end of last week in rather dramatic fashion in terms of the amount and speed of the decline.  Hence the retitling of our paper to “Is Correction Our Direction?” Continue reading

Posted in Research | Leave a comment

A Note on Current Market Volatility

Market Volatility:

Market activity today has been ugly, with U.S. markets down over -5% at one point, following weak overnight results from Asia.  Local China A share markets fared much worse, losing nearly -10% on the session, wiping out this year’s gains.  However, prices seem to have recovered a bit in the last hour from the very uninspiring start at the open. Continue reading

Posted in Research | Tagged , , , , , , , , , , , , , , , , , , , | Leave a comment

Weekly Economic Update

Economic Update 8-24-2015

  • Economic data in the U.S. was again mixed, with regional manufacturing surveys offering conflicting results, while housing metrics turned out well and showing some moderate improvement. However, the story abroad was the problem, as Chinese manufacturing survey figures showed continued contraction.
  • Equity markets globally reacted with the strong negative returns, in response to global growth concerns.  Consequently, bonds fared well in the risk-off environment as interest rates fell sharply. Crude oil fell to new multi-year lows in the $40 range, while gold rebounded somewhat as a safe haven.

Continue reading

Posted in Economic News | Tagged , , , , , , , , , , , , , , , , , , , , , , , , , , , , , , , , , , , , , , , , , | Leave a comment

FANN Radio – “Is Flat the New Up?” – 8/20/2015

Join Brad Kasper, President & CFO of LSA Portfolio Analytics, and Bud Kasper, President of Barber Financial Group, as they discuss the challenges faced after a market close that saw the S&P 500 lose over 2% and how it relates to Bud’s newly released article “Is Flat the New Up?” Click here to view of this and other recently posted FANN Radio recordings. If you are not a member but would like to watch this recording e-mail us at support@lsaportfolios.com.

Fann Radio Slides

Financial Advisors News Network is recorded in the LSA studio and is a substantial resource for timely topics. FANN is used to discuss a variety of information such as: portfolio updates, talking points to use with your clients, quarterly commentary and features current LSA members with best practice ideas.

Posted in Research | Tagged , , , , , , , , , , , , , , , | Leave a comment

Weekly Economic Update

Economic Update 8-17-2015

  • Economic data on the week generally turned out mixed to better than expected, with positive results in retail sales and industrial production, while several employment metrics were a bit weaker.
  • Despite weakness early due to concerns about the Chinese currency devaluation, markets rebounded to result in a positive week in the U.S., while foreign stocks generally lost ground.  Bonds were little changed as yields across the curve barely budged.  Crude oil prices fell in the U.S. by a few percent, while Brent crude and gold rose—resulting in just a slight decline in commodity indexes overall.

Continue reading

Posted in Economic News | Tagged , , , , , , , , , , , , , , , , , , , , , , , , , , , , , , , , , , , , , , , , , , , | Leave a comment

Chart of the Week: Putting the 2007 Recovery in Perspective

Recovery

Click image to enlarge

Entering into the 3rd quarter of 2015, the US is now 6 years removed from the trough of the 2007-09 recession. The chart above shows the progress of the subsequent recovery over those 6 years, and compares it relative to past recoveries dating back until 1980. The most recent GDP report showed the current economic recovery continues to move in the right direction. The 2nd quarter annual rate of growth came in at 2.3%, and a previous 1st quarter contraction of 0.2% was revised to a 0.6% expansion. However, this puts the first half of 2015 at a pace slower than the already meager 2% average annual rate of growth we have been experiencing since 2012. This sluggish growth has led to the weakest economic recovery in postwar history.

SOURCE


Posted in Research | 1 Comment

Weekly Economic Update

Economic Update 8-10-2015

  • Economic data for the week was generally decent, with the ISM manufacturing and non-manufacturing reports showing expansion, an improved willingness of bankers to lend, and a jobs report generally on par with expectations—showing continued growth in a variety of areas.
  • Equity markets in the U.S. fell with a few mediocre earnings reports and fears of a Fed rate hike sooner than expected.  Bonds were oddly mixed, with results dependent on yield curve status.  Crude oil continued to struggle, with lower pricing on the week, which brought down commodity markets overall.

Continue reading

Posted in Economic News | Tagged , , , , , , , , , , , , , , , , , , , , , , , , , , , , , , , , , , , , , , , , , , , | Leave a comment

Chart of the Week: Predicting Rate Changes

Chart of the Week: Predicting Rate Changes

rate_outlook_chart5_Jun29_2015

Click picture to enlarge

This week’s chart shows just how difficult it is to predict rate changes. The black lines represent five quarters of median forecasts of the yield on the 10-year U.S. Treasury. The orange line represents the actual realized yield during that particular point in time. These forecasted predictions come from the Survey of Professional Forecasters (SPF), as measured by the Federal Reserve Bank of Philadelphia. It is easy to see that forecasters have been too bearish on bonds for the past 10+ years, consistently overestimating future increases in rates.

SOURCE


Posted in Research | Tagged , , , , | Leave a comment

Weekly Economic Update

Economic Update 8-03-2015

  • Economic data last week was highlighted by a lukewarm GDP report, mixed housing and consumer confidence surveys, but more positive near-term industrial reports.  The FOMC meeting statement didn’t offer any radically new insights, as expectations for an initial rate hike continue to be focused on later this year.
  • U.S. equities performed positively on the week with decent earnings reports, and foreign stocks were largely in line.  Bonds also gained as investors apparently felt comfortable with the Fed’s current hints on interest rate policy.  Commodities suffered additional losses this week, as crude oil fell below $50/barrel, ending a painful July for the energy patch.

Continue reading

Posted in Economic News | Tagged , , , , , , , , , , , , , , , , , , , , , , , , , , , , , , , , , , , , , , , , , , , , , , , , | Leave a comment

Fed Note

Fed Note:

The FOMC meeting ended today and resulted in no policy changes, as expected. 

The meeting was a ‘lighter’ version than normal, meaning there wasn’t a Q&A at the end and the other bells and whistles that accompany major meetings (not all Fed meetings have the same formality).  Now, the conversation is focused on what type of rate hike will happen between now and end of 2015.  We know it will probably be a 0.25% increment; we just don’t know if we’ll get one (Sept. or Dec.) or two (Sept . and Dec.).  Odds seem to be tipped in favor of just one at this time.  There’s a Fed meeting in Oct., but, like today, it’s a ‘minor’ meeting with no press conference afterward and no release of new economic/rate projections, so a regime change then is considered unlikely.

In reviewing the dashboard: Continue reading

Posted in Research | Tagged , | Leave a comment