
Click image to enlarge
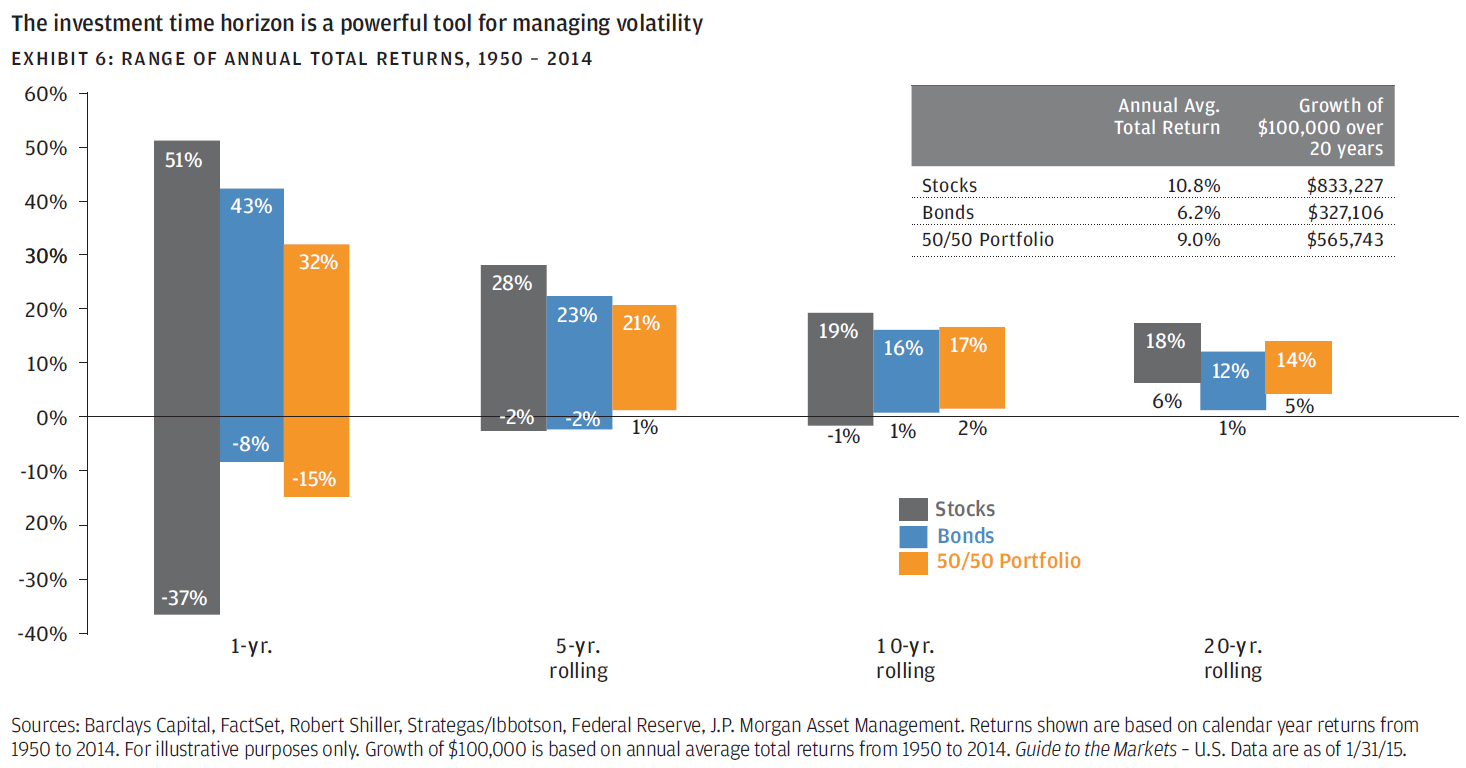
After shedding more than 1,000 points last week, the Dow Jones opened up Monday free-falling another 1,089, spreading panic throughout markets. These kinds of corrections cannot be predicted, however they are inevitable. The last time the market corrected (defined by losing 10% from peak to trough) was over 1,000 days ago, a streak that has only occurred 2 other times in history. On average, the market corrects itself every 357 days, or about once a year1. The important thing for advisors to remember is to maintain perspective of your clients’ investment horizon. The chart above is from a piece from JP Morgan’s James C. Liu. It shows the range of annual total returns for stocks, bonds, and a 50/50 portfolio over investment horizons of 1 year, 5 year, 10 year, and 20 year. As the chart shows, expanding the holding period just 5 years dramatically improves the risk/return each asset class, not to mention there has never been a 5 year period in the post-war era where a 50/50 portfolio experienced losses.

