
Click image to enlarge
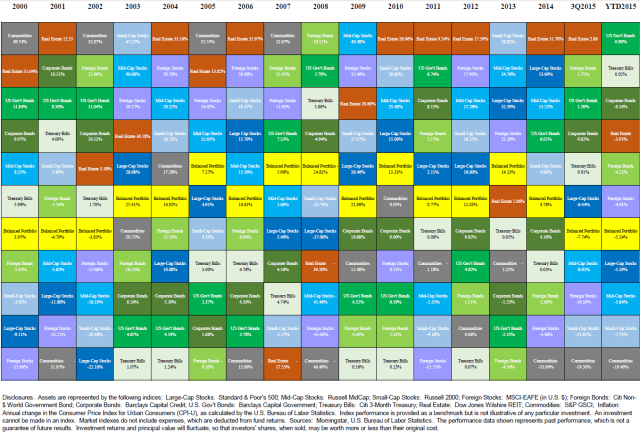
As we wrap up a turbulent third quarter, it seems the year of 2015 will be defined by increased volatility and uncertainty… characteristics of investing that make diversification so important. This week’s chart ranks the yearly returns of various asset classes going back to going back to 2000. As you can see from the color coding, there is very little consistency of year-by-year performance across the asset classes. The performance of an asset class in any given year has no bearing on how it will perform the following year. Implementing a balanced portfolio is of significant importance when attempting to provide more certainty and protection from downside risk, allowing peace of mind for you and your clients.

