
On a holiday-shortened week, we ended up with a few noteworthy reports.
(-) The Empire manufacturing survey for February came in positive at +4.5, but weaker than the expected +8.5 (and lower than January’s +12.5). In the details of the report, shipments and new orders fell sharply, and employment fell by just a point, so negative all the way around. We get tired of talking about the cold winter weather (we will again later), but conditions in New York have been especially cold relative to average, so it would not be surprising to this having an impact.
(-) The Philadelphia Fed manufacturing index was much weaker than expected for February, coming in at a negative -6.3 versus January’s +9.4 and an expected +8.0 reading. Most components of the survey came in weaker, including new orders, output and employment (with the exception of 6-mo. ahead cap-ex spending plans, which improved), with additional anecdotal commentary noting a ditto on the severe weather role.
(+) The preliminary Markit PMI survey increased 3 points to 56.7 for February, which compared favorably to an expected largely flat reading. New orders and output rose by several points, while employment rose by just under a point. Compared to other disappointing surveys as of late that may have experienced significant weather impact, this was a bit of good news. This indicator has been more closely watched as of late since it does have some loose correlation to the ISM indicator.
(0) The producer price index (both headline and core) rose in January by a minor +0.2%, but a tick above expected. The flattish numbers included a change in definitional treatment for some government purchases, exports and services; the only significant moving piece was a +3% gain in pharmaceutical prices. On a year-over-year basis, PPI rose +1.7% and +1.3%, respectively, based on the old and new definitions used.
(0) The consumer price index, like PPI, rose at a tempered rate for January, gaining +0.1% on both a headline and core level, both of which were in keeping with forecast. In the underlying figures, energy utility prices rose over +2% due to higher natural gas prices, offset by a -1% drop in gasoline. In the core component, rent and owners’ equivalent rent both dropped, while services prices rose a few tenths, so many components neutralized each other on a net level. For the trailing twelve months, headline and core inflation both also gained a similar +1.6%, so well-contained…in fact, almost too contained based on the Fed’s preferred 2% target.
(-) The NAHB housing market index for February came in a lot weaker than expected, falling 10 points from January’s 56 (same as this month’s expectation) down to 46. Present single-family sales fell over ten points, while future single-family transactions and prospective buyer traffic were almost as bad. All regions saw declines (West being the steepest), and the group generally blamed the weather for the bulk the drop, in addition to the availability/cost of workers and supplies (which could be directly related to the storms as well).
(-) Housing starts for January fell -16.0% to 880k (seasonally-adjusted annualized rate), which sharply underperformed the expected -4.9% drop; however, some upward December revisions altered things somewhat. The single- and multi-family groups were evenly poor, so there was unusually little differentiation for the month. Building permits also lost ground, falling -5.4% compared to an expected decline of -1.6%, with multi-family permits falling over -12% and single-family just over a percent. Just to put this into perspective, we still need 1.5 million new homes a year or so to keep up with household formation demand on a demographic side—we’re still not there yet.
(-) Existing home sales for January came in lower than hoped, falling -5.1% compared to an expected -4.1% decline. The single-family group, falling -6%, represented the entire amount, as condo/co-op sales were generally unchanged. Additionally, all four U.S. regions were down, as the Northeast/South fell over -3% and West/Midwest lost just over -7%. Of course, questions about potential weather impact remain here as well.
As with other economic data, these types of real estate measures are seasonally adjusted (taking into account the fact that much more building goes on during the summer than in winter), although the seasonal adjustment factors themselves don’t always go back for a large number of years, so extreme readings even during seasonally weak months can get these adjustments out of whack. Weather—cited by respondents as a major problem in the homebuilders’ index released during the week—mostly likely contributed to the decline in starts and overall sales activity (Midwest starts were apparently the worst in over five decades), which is intuitive. If shoppers aren’t getting to the mall, they certainly aren’t taking time out for Sunday open houses. The better test will be as the nation thaws and what the early spring numbers bring.
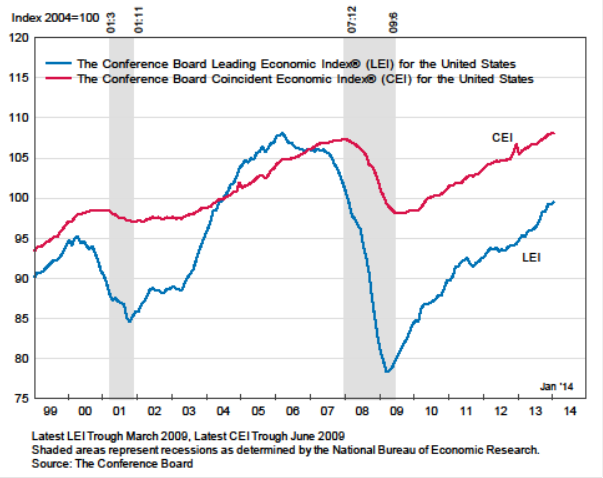
(+) The Conference Board’s index of leading economic indicators rose +0.3% in January, which was an improvement on the flat December. Positive inputs originated from unemployment claims and financial indicators (like interest rate spreads), while building permits, manufacturing activity/hours and ISM new orders were a negative input. The coincident and lagging indexes also rose, +0.1% and +0.3% respectively. As we can see, despite the monthly noise, the longer-term trend is fully intact.
(+) Initial jobless claims for the Feb. 15 ending week fell just slightly, by 3k to 336k, just a tick higher than expectations calling for 335k. Continuing claims for the Feb. 8 week rose by 37k to 2,981k, which was a bit higher than the 2,970k expected.
The FOMC minutes from the January meeting were as expected for the most part, other than comments from committee participants discussing potential changes to forward guidance language as the unemployment rate nears the pre-set 6.5% threshold. They all seem to agree that an updated, looser measure is likely appropriate to continue the easing message; however, no one seemed to agree on how to do it. Some commentators took this as a ‘hawkish’ indicator, in that rate increases could be closer to reality than initially thought, but a closer look at the wording doesn’t necessarily hint at this (however, a speech given later in the week by Dallas Fed president Richard Fisher may have given that impression). Tapering was mentioned, mostly in the tone that committee members believe it should continue as planned barring any significant changes to the underlying data or outlook—so a continuation of the asset purchase wind-down remains the default choice.
The argument to raise the federal minimum wage over several steps from $7.25 to $10.10 hit somewhat of a speed bump as the Congressional Budget Office claimed doing so might offer mixed results. On one hand, it claimed a potential lift of 900k families out of poverty and raising the standard of living for 16.5 million current low-wage workers (15% of the total workforce); on the other hand, it could eliminate 500k jobs from the economy. The less dramatic ‘$9.00’ minimum wage option naturally resulted in a lessened impact in both the positives and negatives.
This is a politically-charged area of debate, and a testy economic one as well. Classic economics tells us that setting minimum wage levels (or any type of ‘artificial’ price on a good or service, for that matter) isn’t efficient. In the Laissez-Faire school of thought, if market forces are left to their own devices, workers are paid according to their individual economic value as well as prevailing supply and demand forces. So, if there happens to be a glut of low-skill workers, employers keep the upper hand and can pay the lowest possible wage workers will accept (and have often done so historically). However, this situation can create some other problems, such as if the market wage falls below the cost of living, so if this mismatch gets too extreme, it can lend itself into a catalyst for social unrest. In the last century, this led to the creation of trade unions and legislating minimum per hour pay standards in several nations in the late 19th and early 20th centuries (New Zealand and Australia were first, followed by several U.S. states, such as Massachusetts, before it was done federally in a wave of Great Depression-era legislation in 1938).
While some economists have suggested that higher minimum wage levels increase unemployment for younger and lower-skill workers—essentially pricing them out of the workforce—the view is far from unanimous. Other economists and political operators feel the social benefits of a ‘living wage’ outweigh the costs. And, like many conditions in economics, the results aren’t measurable with precision due to the confluence of other factors involved.
Business behavior is somewhat predictable, though, in that owners seek to consistently maximize profits and keep expenses as low as possible. For many (or even most) firms, payroll represents the largest operating expense, so an increase in required hourly pay either requires a shrinkage of profit margins (owners no doubt bristle at this prospect) or other adjustments. To keep the payroll cost math constant, changes could include simply using fewer workers at a higher per-hour rate as opposed to more of the lower-paid variety. If this happens often enough, the impact could certainly get to the 500k estimated jobs lost. It wouldn’t necessarily be this extreme, or it could be worse, but these impacts would start at the micro-level.
| Period ending 2/21/2014 |
1 Week (%) |
YTD (%) |
| DJIA |
-0.27 |
-2.46 |
| S&P 500 |
-0.08 |
-0.34 |
| Russell 2000 |
1.35 |
0.19 |
| MSCI-EAFE |
1.57 |
0.65 |
| MSCI-EM |
0.20 |
-4.33 |
| BarCap U.S. Aggregate |
0.08 |
1.53 |
| U.S. Treasury Yields |
3 Mo. |
2 Yr. |
5 Yr. |
10 Yr. |
30 Yr. |
| 12/31/2013 |
0.07 |
0.38 |
1.75 |
3.04 |
3.96 |
| 2/14/2014 |
0.02 |
0.32 |
1.53 |
2.75 |
3.69 |
| 2/21/2014 |
0.05 |
0.33 |
1.56 |
2.73 |
3.69 |

