
Economic Update
The week’s economic data was generally disappointing, as reports covering the January time period were likely held back by the extreme winter weather over much of the nation. The magnitude of weather impacts can be hard to measure precisely, but as they’re also noted specifically in anecdotal comments, there was an effect to at least a certain degree.
(-) The ISM manufacturing index fell more than expected, from December’s 56.5 reading to 51.3 for January (compared to a forecasted 56.0). In fact, this was the sharpest decline since May 2011. In the details, new orders, production and employment were all down, as were inventories; and the prices paid component (likely natural gas-related) rose on the month, which was an additional headwind for manufacturers. However, it should also be noted that weather was indicated as an anecdotal reason for some of the poor numbers. So, we had growth, but it was far below the acceleration expected, and markets reacted sharply to the negative by selling first and asking questions later.
(0) The January non-manufacturing ISM report, at 54.0, was less of a disappointment than the manufacturing version, as it both improved on the December number of 53.0 and came in largely in line with expectations of 53.7. Under the hood, business activity, employment and new orders all improved, as did inventories. It appears poor weather played less of an impact on non-manufacturing activity than on manufacturing activity during the past few weeks, which, due to the nature of the various businesses being measured, makes more intuitive sense (computers don’t stop working just because of bad weather, although strength was also seen in retailing and professional services, which could have some tempered impacts from bad weather). Anecdotal references to activity also appeared more optimistic on the service side.
(0/+) The final Markit PMI survey for January came in similar to estimates, at 53.7 versus a consensus of 53.8 expected, but was just over a point weaker than December. Like the ISM, most components declined, such as output, new orders, employment and finished goods stocks all declined. Weather was mentioned as a possible catalyst.
(0/+) Construction spending for December rose +0.1%, compared to expectations for no change; however, two prior months were revised down by a few tenths of a percent each. Residential spending rose +2.6%, which was the leader of the private spending category (which itself rose +1%), while public spending fell over -2%.
(-) Unit motor vehicle sales fell a bit from 15.3 mil. units in December to 15.2 mil. for January, which underperformed the expected 15.7 mil. figure. However, on the positive side, domestic auto sales rose 0.2 mil. to an expected 11.9 mil. Here, also, automakers pointed to harsh winter weather as a backdrop for weaker sales.
(+) Factory orders for December came in a bit better than expectations, falling -1.5% compared to expectations of a -1.8% decline. The underlying detail was a bit better, as core capital goods orders and shipments were revised up by about a half-percent from initial durable goods reports.
(0) Non-farm productivity for the 4th quarter rose +3.2%, surpassing the +2.5% gain expected, up to +1.7% on a year-over-year basis. Unit labor costs fell -1.6% for the quarter (compared to an expected drop of -0.5%), and -1.3% on a year-over-year basis. Revisions took place for both measures in the same direction for the prior quarter, and total compensation per hour rose at a rate of +1.5% for the year. What figures like these continue to tell us is that we’re not seeing blatant wage increases, a frequent precursor to inflationary pressures elsewhere.
(-) The December trade deficit widened out to -$38.7 billion, compared to the forecasted -$36.0 bill. The net petroleum balance was little changed, but the ex-petroleum account widened by $3.8 bil., as exports declined (particularly in automobiles, which fell -6%).
(0) The January ADP Payroll Report came in just below expectations, with a gain of +175k compared to the consensus +185k. The largest job additions were seen in professional/business services (+49k), while manufacturing jobs fell -12k. The previous report for December was revised down a bit to +227k, but still outperformed the +87k government payroll number. It seems the ADP report may be less influenced by weather (due to a different calculation of ‘time off’ than the DOL survey), but the numbers still often diverge from the big employment report.
(+) Initial jobless claims for the Feb. 1 ending week fell to 331k, from a the prior week’s revised 351k figure and lower than the 335k forecasted figure. Continuing claims for the Jan. 25 week rose by 15k to 2,964k, but was a bit lower than the 2,998k expected. The increase in claims has been swept under the rug as normal seasonal volatility, but closer research shows that it could be due to some technical issues having to do with the expiration of the emergency unemployment compensation program (which we’re not entirely surprised by). For example, regular and extended claims in some states may have become intermingled, which most certainly would have convoluted the results. This may have happened for system reasons, such as to ease in re-starting claims for eligible folks if Congress decided to extend the emergency program. Nevertheless, it’s caused some problems in getting accurate numbers for whatever reason. We’ll give it a few more weeks to sort itself out before assuming a deeper meaning.
(-) The big Friday employment report for January was a bit of a dud, with establishment survey nonfarm payrolls coming in at +113k for the month, which underwhelmed the +180k expected. It was a bit more convoluted of a report than normal, with several revisions for prior periods and benchmark survey data going back a year, and the market seemed to shrug off the report as weather-driven.
On the positive side, the revisions for November and December were higher and netted an additional +34k jobs, which helped the base. Construction jobs were up +48k and more than reversed losses of the prior month. On the negative side, retail trade jobs fell -13k, a dramatic change compared to December’s gain, and health/education services jobs lost ground again, as did government employment, which was down almost -30k.
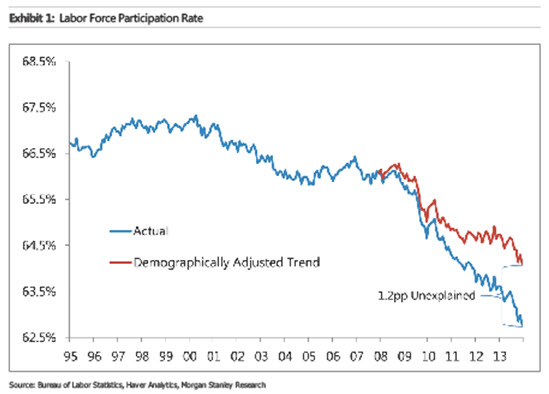
The unemployment rate fell another tenth to 6.6%, despite calls for no change to the prior month’s result and household survey employment rose by +638k. Labor force participation rose two-tenths to 63.0%, contrary to expectations and discussion about the troubling trend downward. Additionally, the U-6 measure of broader underemployment fell four-tenths to 12.7%. Average hourly earnings rose +0.2% for the month, which was on target with forecast, and the average workweek was unchanged at 34.4 hours.
We won’t digress again into a long chat about the labor participation rate, but it does appear to be one of the more closely watched variables this year, particularly because it directly affects the calculation of the headline unemployment rate. We continue to find a substantial difference in opinion between economists about the causes (hint: the cyclical vs. structural thing again). While the Fed’s opinion has pointed more toward cyclical, we see other evidence of a structural shift—shown by the participation rate declining since 2010 when jobs began to be added to the rolls. So, without delving into a huge amount of detail, the bottom line appears to be down to a few possible culprits as to what’s causing the rate decline.
One is the ‘aging of America’ theme, which began prior to the Great Recession and may end up carving off 0.20% off the participation rate per year at current trend. The extension of unemployment insurance in recent years may have allowed a convenient ‘bridge’ for workers after full employment as they ease into receiving Social Security payments, as have disability payments, although debate exists regarding how well the disability measure captures ‘employable’ individuals (although over the last decade, this number has grown from 3 to 9 million). On the cyclical side, workers going back to school to improve skills has been seen in higher college enrollment rates. Others are staying home to care for children, since the ‘break-even’ between working at a lower-paying job and paying for expensive childcare just didn’t make economic sense. We’ve been told of this may times directly from individuals making that choice.
Lastly, and something we’ve touched on before is the ‘automation of America,’ which is the substitution of routine functions with computers or machinery, in both manufacturing (such as automobile assembly) and even services (think of video rentals as a tangible example, but there are many others). This latter trend is a bit more troubling as it may eventually result in an eventual elimination of certain types of jobs, which need to be replaced somehow.
Why do we care? Poorer employment prospects or changed expectations lead to different expectations for Fed policy, and that affects interest rates, as well as inflation and markets. Fewer workers means fewer consumers, which affects GDP and company revenue, and poorer conditions mean lower rates for a longer period of time. Without casting a dire scenario, we’re again reminded of the exceptional amount of human ingenuity we have been the beneficiaries of during the last few decades, and no doubt this will continue. In like manner, the workforce must change along with it, but no doubt there will be some pain along the way as there is with any type of change during history.


