
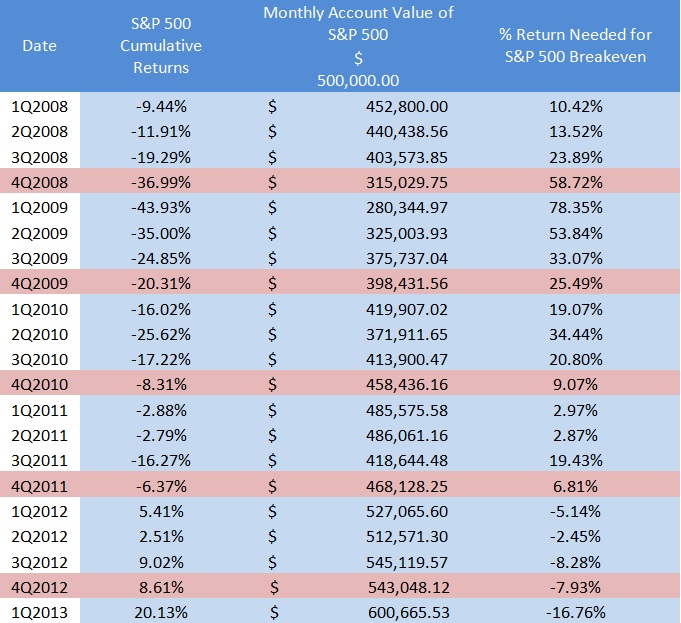
Every quarter LSA will post our Break Even Analysis that shows the impact of drawdown in an account. The term drawdown refers to the peak to bottom drop an investment experiences or in simple terms what was the biggest percentage loss experienced. This chart reflects the biggest cumulative drop of the S&P 500 over this timeframe is negative 43.93% which would have taken a $500,000 account down to $280,344.97 and had this been a live account you would now need to make 78.35% to regain all those losses. Although you might believe that if you lose 50% and make 50% you are back where you started it is just not the case. Losing 50% in your portfolio would require 100% positive return to regain your losses. If you recall from a previous chart of the week we released an article with the headline “It’s Not What You Make but What you Keep!” The BEA helps tell this concept and the big question investors should have is how did my portfolio do during this time frame? Although we continue to see “New Record Highs” for the S&P 500 remember it took over 5 years regain the losses from 2008 and in retirement this could be very difficult to recover from.
Make sure you understand the importance of downside protection in a portfolio and how to mitigate the severe swings of the market.

