
It was a downbeat week, at least relative to many so far this year, but we knew there needed to be a pause in the flurry of good news at some point. This did not come as a drastic surprise, as a few positive factors have begun to even out during the last few months and the sequester impact may have started to inch into the underlying data somewhat.
(-) The ISM manufacturing survey came in weaker than expected, which affected market sentiment due to the ISM’s broad following. The index fell to 51.3 compared to a consensus expectation of 54.0, as several underlying components dropped—such as new orders, production as well as inventories. However, the employment segment rose a bit. Overall, with a few monthly exceptions, ISM has remained strong (the true measure is its being above 50—which is the most important part of this diffusion index and signifies a positive result as opposed to negative). In line with other measures, the employment component of this survey has steadily been improving, albeit slowly. It is possible that some seasonal and inventory/price-related effects may have altered the numbers, but that is only speculation at this point.
(-) The March non-manufacturing ISM index fell as well, from February’s 56.0 to 54.4. This was compared to an expected consensus 55.5 reading, so the decline was to a lesser degree than was the manufacturing variety. In this survey, employment fell, as did new orders and overall business activity. While this now stands at a 7-month low, the above-50 reading is still more bullish than bearish.
(+) Construction spending rose +1.2% for February, which outperformed expectations of a +1.0% gain. Residential building was up +2.0%, while nonresidential gained a less significant +0.7%. A nearly -17% drop in the power/oil/gas/electricity group, the largest piece of the non-residential group, accounted for a big part of this. Federal spending also dropped about a percent, which is not a surprise.
(0) Factory orders for February were up +3.0%, generally in line with the expected +2.9% figure and January’s -2.0% drop was trimmed to -1.0% in a revision. In the details, core capital goods orders fell -3.2% in the month while capital goods shipments rose +1.9%. Various types of inventory measures largely offset each other.
(0/-) Unit motor vehicle sales for March came in a bit under February levels and under expectations, at a seasonally-adjusted 15.2 million units versus a forecasted 15.3 million figure. These numbers have generally been consistent since late 2012.
(+) The trade deficit narrowed more than expected, from a revised Feb. figure of -$44.5 billion to -$44.4 bill., under the forecast of -$44.6 bill. These numbers are often driven by petroleum prices, but imports were flat on the month while exports rose by almost a percentage point—in the industrial supplies area.
(-) The ADP employment report for March showed job gains of +158k, which was significantly below expectations of a +200k reading. The slowed growth in jobs came from construction as well as trade/transports/utilities, which had been on a solid clip for the past several months but fell off somewhat in March (a comment from ADP referred to perhaps a decline in post-Sandy recovery building being a possible cause for this). Employment at smaller firms gained +74k, which outgained both medium-sized and larger firms—which is quite a shift from trends during the past few years—and has recovered to its pre-recession peak. One problem with the unemployment situation was a lack of hiring in these small companies, due to uncertain prospects and general hesitation to make capital and personnel investments, but this appears to be getting a bit better.
(-) Initial jobless claims for the Mar. 30 week jumped to a seasonally-adjusted 385k, which surpassed the expected 353k number forecast. However, they fell 2k on a non-seasonally-adjusted basis, the difference likely being Easter and spring break timing differentials, so this may less accurate than normal. Continuing claims for the Mar. 23 week came in at 3,063k, which was a bit above the 3,050k expected.
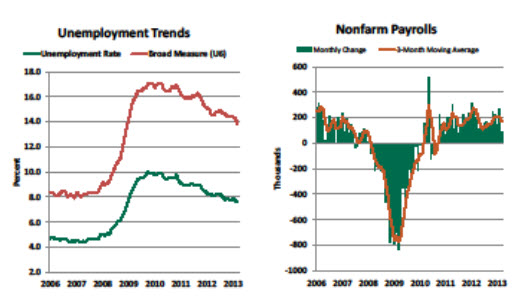
(0/-) The monthly government employment situation report was released Friday and gave us two always-newsworthy metrics: (1) nonfarm payrolls for March that experienced a lackluster gain of +88k and (2) the unemployment rate dropped to 7.6%. Compared to expected, the payroll number was a big disappointment (consensus was an addition of +190k jobs); especially compared to an upwardly revised February number of +268k. In looking at underlying details, retail jobs were hit the hardest (both clothing and building materials/gardening), and construction employment ‘only’ gained +20k jobs (lower than recent trend). Did the government sequester have some effect? Perhaps, and probably on the order of 10,000 jobs, but that’s far from exact (derived from economist estimates), while the payroll report pegged government employment losses at -14k last month—all of which were actually a result of restructurings at the post office as opposed to politics. Temporary employment gained +20k, though, which can be a precursor to more permanent full-time hiring.
The unemployment rate had been expected to remain unchanged at 7.7%, so this was a positive on the surface, but for the fact that it was due to a drop in labor participation (by -0.2%, to 63.3%—which represented 500,000 people), which shrunk the overall counted pool and boosted the number. This has been an ongoing condition. The shrinkage was widespread among both adult men and women, as well as teens, so fairly broad-based. As we can see below, though, the trend in unemployment has moved steadily downward over the last several years—slower than what economists and policymakers would like to see at this stage of the recovery cycle.
In other stats, average hourly earnings were flat for March, which disappointed slightly, as the expectation was a gain of +0.2%. For the past year, the gain was +1.8%—in line with CPI inflation. Weekly hours worked rose +0.3% and aggregate hours (people working times hours worked) have moved upward at an annualized rate of +3.5% for the past three months. Both of the latter are moderate positives.
Source: Northern Trust, Bureau of Labor Statistics, Haver Analytics.
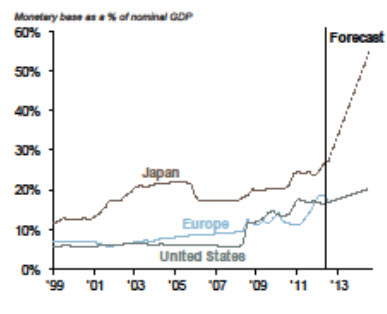
In foreign news, neither the ECB or the U.K. elected to drop rates any further, despite a lackluster economic outlook. Both are staying the course on current easing policies, while keeping potential inflation-building pressures in check. By contrast, the Bank of Japan followed up their re-inflation plan by unleashing another one to unleash an unprecedented amount of stimulus into their economy—$1.4 trillion worth over the next two years (double the previous estimate). This effort is a jump-start attempt of sorts to get the economy out of a two-decade period of growth stagnation. Their goal is 2% inflation within two years, and the steps are extreme in order to get there. Additionally, they’re abandoning specific interest rate targets in favor of using the monetary base as the primary target for accommodation levels (estimates show that the nation’s monetary base could rise from 30% at the end of last year to 55% of GDP by the end of 2014 at this rate). Also, it appears that certain Japanese equities and ETF’s will be targeted for purchase.
By contrast, the U.S. Fed’s moves have been much smaller by comparison—and could reach a maximum of 20% of our GDP. Japanese stocks rose naturally, as this also serves the secondary purpose of weakening the Yen further against other developed market currencies—the Yen has traditionally been seen as a ‘safe haven’ currency and has been prone to being somewhat overvalued to competing currencies due the lack of inflation and growth that the BOJ is now specifically trying to remedy.
| Period ending 4/5/2013 |
1 Week (%) |
YTD (%) |
| DJIA |
-0.06 |
11.87 |
| S&P 500 |
-0.98 |
9.52 |
| Russell 2000 |
-2.96 |
9.07 |
| MSCI-EAFE |
-0.77 |
4.32 |
| MSCI-EM |
-2.59 |
-4.46 |
| BarCap U.S. Aggregate |
0.80 |
0.67 |
| U.S. Treasury Yields |
3 Mo. |
2 Yr. |
5 Yr. |
10 Yr. |
30 Yr. |
| 12/31/2012 |
0.05 |
0.25 |
0.72 |
1.78 |
2.95 |
| 3/29/2013 |
0.07 |
0.25 |
0.77 |
1.87 |
3.10 |
| 4/5/2013 |
0.07 |
0.24 |
0.68 |
1.72 |
2.87 |

