
It was an especially busy week of the month for housing-related data.
(-) Existing home sales rose +0.8% for the month of February, which was a bit light compared to the +1.6% gain expected (however, a revision upward for the prior month partially tempered the disappointment). Single-family sales were down -0.2%, while condo sales gained +8.8%. However, this group is much smaller and quite volatile month-to-month—as is all housing data in the short-term, at least to some extent. The ‘months supply’ of homes on the market rose a bit, by +0.4 months to 4.7 months, although this remains dramatically below levels of recent years.
(0) Housing starts were a bit disappointing for February, with a gain of +0.8% versus an expected +2.8%. However, the lighter Feb. numbers were offset by a Jan. revision upward—so net-net, everything was in line with expectations. Single-family starts were up +0.5%, while multi-family gained +1.4%. The Jan. revision for multi-family was largely a change from a very negative to a less negative number, which gives a sense of the breakdown where building is continuing to occur, albeit choppy from month-to-month. Over the trailing year, however, total housing starts are up +27.7%, with single-family up +31.5%—both of which are very strong annual results and reflect the continued improvement in the housing space.
(+) Building permits for February are also significantly higher, up +4.6% versus a consensus gain of +2.3%. Single-family and multi-family rose +2.7% and +8.1%, respectively. Again, this is in keeping with the recovery trend.
(0) The FHFA house price index, which measures homes with Fannie Mae/Freddie Mac-guaranteed mortgages, gained +0.6% in January, which was just a shade below the forecasted 0.7% increase expected, and showed a gain of +6.5% for the past 12 trailing months. From a regional standpoint, the Pacific and Mountain regions showed the strongest gains, in keeping with their larger losses during the financial crisis.
(-) The NAHB housing market index fell more than expected in March, to 44 versus a consensus estimate of 47. The present conditions piece was the largest negative contributor, while future expectations and prospective buyer traffic were positive. This index has fallen a bit in the past few months, but the trend of the last 12 months has been sharply higher—in line with other housing metrics.
(+) In other news, the Philadelphia Fed index rose strongly in March to +2.0, in contrast to the decline in the previous month (at a -12.5 level) and expected forecast level this month of -3.0. The components underlying the headline figure included a gain in new orders, shipments and employment; however, capital spending plans declined a bit.
(+) Initial jobless claims for the Mar. 16 week were a little better than anticipated, at 336k, compared to the forecasted figure of 340k and the four-week moving average continued to decline—to 340k. Continuing claims for the Mar. 9 week came in at 3,053k, which was largely in line with the 3,053k expected. These claim numbers continue to improve and have now fallen to the lowest level since Feb. 2008, believe it or not.
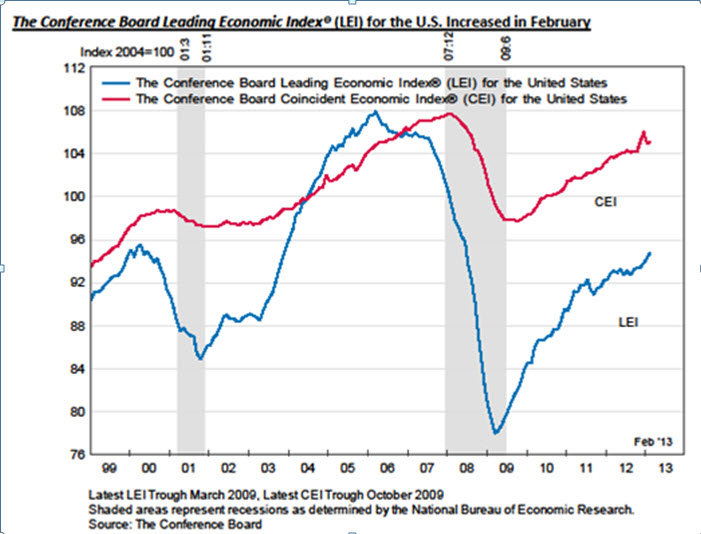
The Conference Board’s index of Leading Economic Indicators rose +0.5% in February to 94.8, matching the level of January’s increase. While consumer expectations and new manufacturing orders were a bit weak on the month, financial components (including stock market results and interest rate spreads), building permits and manufacturing workweek were all positive. By contrast, the coincident indicator rose +0.2%, led by production and payrolls and reversing January’s decline, and lagging indicator rose +0.1%. The trend of these indicators combined (which is the power of this measure), continues upward.
The Fed Open Market Committee met this week and didn’t change a thing, other than reinforce their current quantitative easing policy and acknowledge the improvement in economic data to a ‘moderate pace’ so far this year (as opposed to the ‘pause’ that occurred in late 2012), although the fiscal drag from government uncertainty could be a concern. One interesting note, per the subtle and carefully worded communiques the Fed issues afterward, referenced that the FOMC ‘decided to’ rather than ‘will’ proceed with the $85 billion/month treasury and MBS purchases. Due to the controversy about the ongoing need and possible inflationary byproducts of this high level of stimulus, the decision seems a bit less clear-cut than it was months ago. However, based on internal committee member projections, it appears the average forecast for the initial rate hike is 2015—similar to the estimates of several well-regarded economic groups. It might also be interesting to note that, despite being the target of both criticism and praise, the Fed’s total net revenue last year was $90 billion (the aggregate profitability for all U.S. banks was $141 billion).
What’s been happening in Cyprus anyway? While a tiny nation from a GDP standpoint ($25 billion a year, similar to that of Vermont—the smallest of any U.S. state), its financial sector is much larger (as in about eight times its GDP), due to a reputation for levying low corporate income taxes and being lenient on financial regulation. Consequently, foreigners have used Cypriot banks as a dumping ground for excess cash to some extent (it’s thought that over $30 billion of this is Russian in origin, at least a portion of which may be from dubious sources).
The situation has some investment and sentiment impact on global markets. Cypriot banks (especially, Popular Bank of Cyprus, aka Laiki, the nation’s second-largest bank) have suffered huge losses from Greek bond holdings and have been surviving on emergency ECB funding; however, this support period concludes in March, which has hastened the timing of this current level of the crisis. When this deadline came, it was apparent some sort of bank bailout was needed.
Initially, in order to agree on terms of a bailout, European ministers suggested a graduated tax on all bank deposit assets within the country. This was naturally unpopular, both politically and on the streets, due to the large impact on smaller depositors and earlier promises of bank deposit insurance for accounts up to €100k (akin to FDIC in the U.S.). This plan was derided by many around the globe and rejected unanimously by Cypriot’s parliament.
At this point (as of Monday morning), it seems Cypriot and Eurozone officials have agreed on a €10B rescue plan to resolve the crisis—and will result in the dissolution of Laiki and the creation of a ‘good bank’ and ‘bad bank.’ The Bank of Cyprus (the ‘good bank’) will assume Laiki’s smaller deposits under the Eurozone insurance limit and the larger uninsured deposits, such as Russian business interests heavily invested here, will essentially be frozen and subject to possible write-downs in order to come up with remaining funds needed to pay outstanding debts. Bondholders will also naturally be hit and some capital controls put in place to prevent a flight of cash out of the country.
Perhaps the most worrisome element of the original ‘deposit tax’ concept was the precedent set for doing the same thing in Portugal, Spain or other peripheral nations as an extreme way to get citizens to ‘self-fund’ their own bailouts. If this were seen as likely, bank depositors would rush to pull out assets from their own nations’ banks (a classic ‘bank run’) and move them to ‘friendlier’ countries, like Germany or France. We’ve understood Cyprus to be a bit of a unique case, due to its small size and status as a ‘tax haven’—especially for Russians. While it was always politically untenable to penalize the smaller depositors with a bank tax, this was a way to get these larger firms to pay their share. Perhaps sentiment has turned away from feeling too sorry for the Cypriots, who sit on a recently discovered and potentially substantially large natural gas find (one reason why it was initially proposed for affected depositors to receive natural gas-linked bonds as partial restitution). However, when it’s all said and done, this Euro loan is very large, will set them back substantially through the financial sector deleveraging and may not be the last we hear of Cyprus and bailouts.
One last data point: despite all the news surrounding Cyprus, from a global growth standpoint, China creates the equivalent of a new Cyprus once a week. Something interesting to think about from a relative perspective…
| Period ending 3/22/2013 |
1 Week (%) |
YTD (%) |
| DJIA |
-0.01 |
11.42 |
| S&P 500 |
-0.24 |
9.69 |
| Russell 2000 |
-0.63 |
11.69 |
| MSCI-EAFE |
-1.48 |
5.71 |
| MSCI-EM |
-2.57 |
-3.77 |
| BarCap U.S. Aggregate |
0.30 |
-0.32 |
| U.S. Treasury Yields |
3 Mo. |
2 Yr. |
5 Yr. |
10 Yr. |
30 Yr. |
| 12/31/2012 |
0.05 |
0.25 |
0.72 |
1.78 |
2.95 |
| 3/15/2013 |
0.09 |
0.25 |
0.84 |
2.01 |
3.22 |
| 3/22/2013 |
0.07 |
0.26 |
0.80 |
1.93 |
3.13 |

