
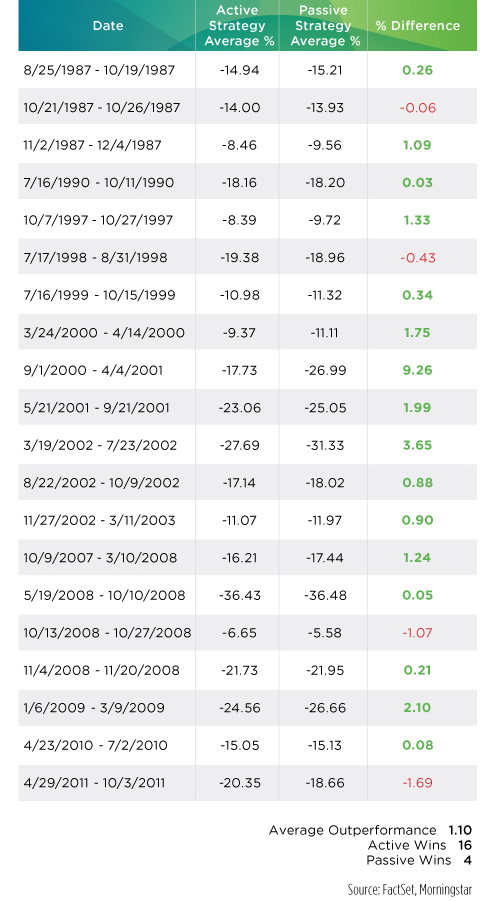
Hartford Funds recently released an analysis comparing the average performance of active management versus that of passive management during each period the market corrected in the past 30 years.1 Hartford removed any index or enhanced index funds from the Morningstar Large Blend category to represent its average active strategy and used the S&P 500 Tracking category to represent its passive. They found that there were 20 market corrections in the past 30 years. Of those 20 periods, active management outperformed passive 16 times, with an average excess return of 1.10%.
Passive management may have looked superior the past few years, but this was during a distorted market environment that favored passive strategies. With the end of QE, the highly anticipated lift off of the zero interest rate policy, and the first market correction in the past 4 years, we are beginning to see the transition from this particular market cycle into a more normalized environment. This would shift favor to active money managers that are skillful in capturing alpha and protecting on the downside, whose strategies have proven to outperform through multiple market cycles.

