
Chart of the Week: Closing the Gap?
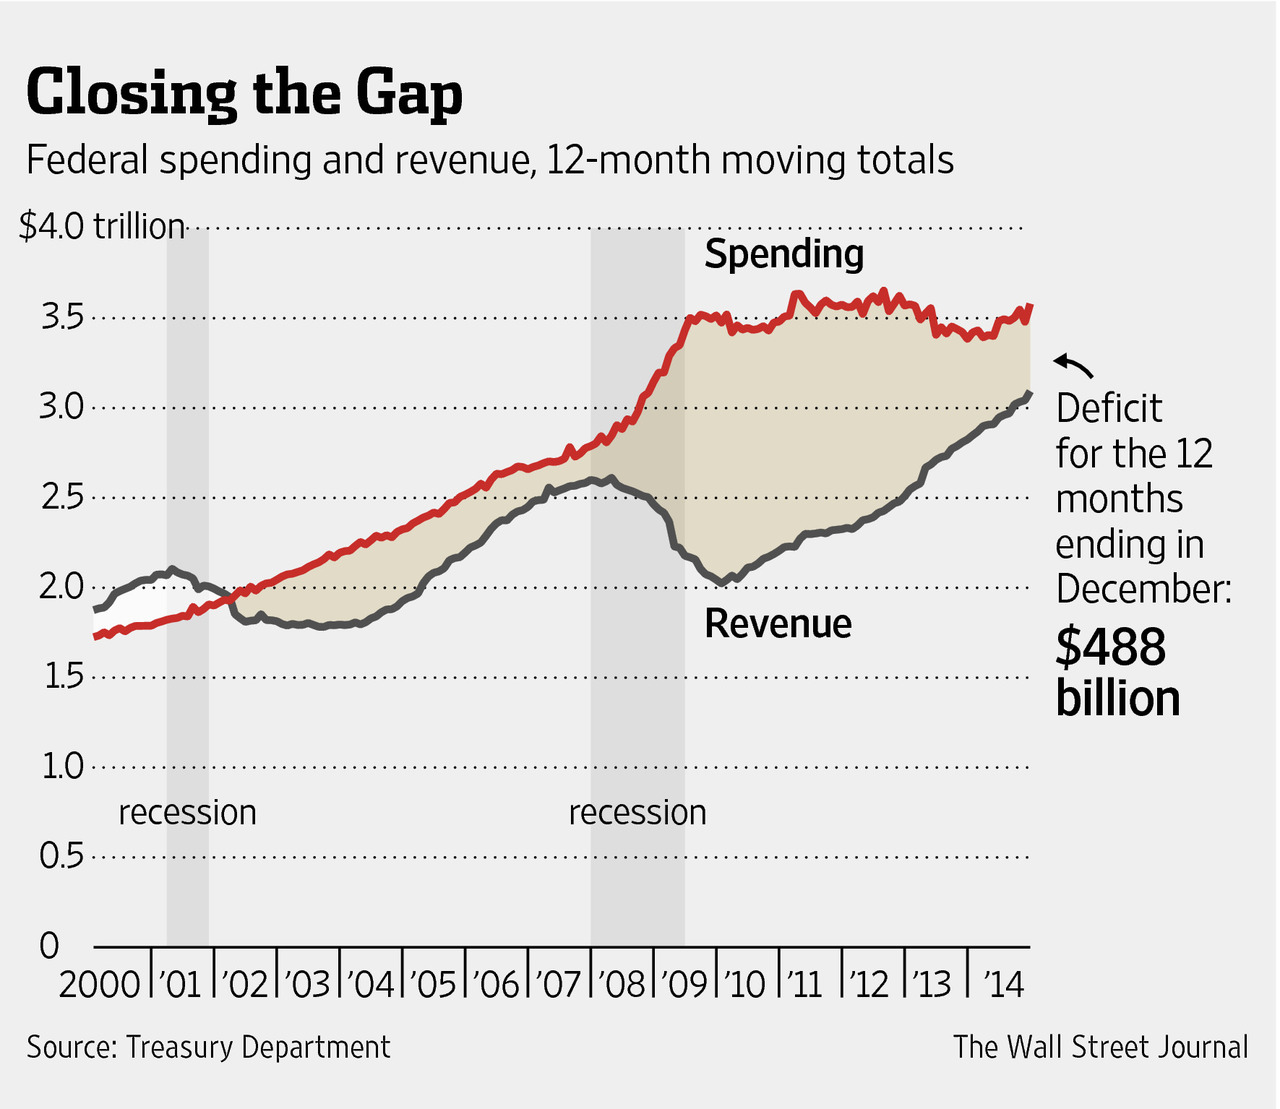
A $2 billion surplus capped off a year that ended with the smallest deficit in the US since 2007, which preceded the $800 billion spending stimulus that started the Obama era. During this time, the deficit soared to 10% of GDP, the highest since WWII. It now sits at a more comfortable 3%, a stat that policy makers are waving proudly. Although this is a step in the right direction, what is not being brought to attention is that total national debt is still over $18 trillion dollars (101% of GDP) and growing. A reduced deficit is still a deficit, meaning the national debt is still increasing, albeit at a slower annual rate. And with the debt ceiling set to be reinstated March 16th of this year, a troublesome spring may be looming.

