
(+) Retail sales rose +0.4% for October, which exceeded expectations of a +0.1% increase. Removing the usually volatile automobile, gasoline and building materials components pushed the gain up to +0.5%, which also outperformed the consensus forecast of +0.3%. The monthly results were led by a +1.3% increase in auto/auto parts sales.
As we look at the upcoming Thanksgiving weekend and important ‘Black Friday’ first holiday shopping day, there is the usual worry about shopper behavior, to the point where temperature and precipitation forecasts are reviewed for possible impacts on weekend turnout. For many retailers, almost half of annual sales are brought in during the holiday season, which explains the intense scrutiny. Overall, though, general levels of employment, wealth and consumer confidence play among the biggest roles in how retail sales turn out—likely this sentiment will matter quite a bit more relative to whether Old Navy opens during Thanksgiving dinner, 5:00 AM Friday morning, or at a more reasonable hour. It’s also a good assumption that online activity will continue to take market share from traditional brick-and-mortar retailing. This had been a major shift with booksellers and electronics stores, but has moved to other items as well.
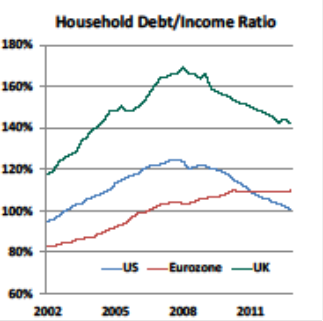
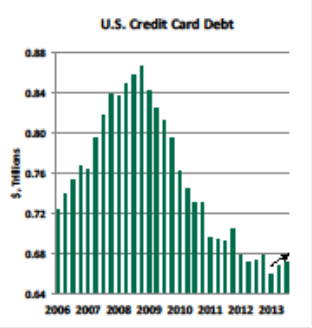
On the positive side, household deleveraging has continued this year, and while domestic credit card debt had fallen to the lowest levels since before the crisis, it appears to have bottomed and began to increase again in 2013—which implies more spending could be happening. But, it may be too early to expect any Christmas miracles just yet.
Source: Northern Trust, Haver Analytics.
(+) Business inventories rose +0.6% for September, which surpassed the forecasted +0.3%. This includes the full total for manufacturing, wholesale and retail inventory amounts (the latter provided the biggest boost). As this is a September number, it may play into a revised GDP figure for the third quarter.
(-) The Philadelphia Fed index came in weaker than expected, similar to last week’s New York area Empire survey, declining from October’s 19.8 to +6.5 for November (vs. a forecasted +15). All segments during the month suffered declines, including new orders, shipments and employment, although the first two segments remained positive and expansionary.
(+) The preliminary November Markit U.S. PMI survey rose to 54.3, its strongest level since March, compared to expectations of 52.3. For the month, output and new orders rose, while the employment segment weakened a bit. Markit, a private information services firm, compiles this lesser-known series, which includes new orders, employment and prices across several sectors—so works in a similar fashion to the broader ISM survey the market watches so closely. These two do tend to correlate, so the input is valuable and it’s becoming more popular.
(0) The October release of the Consumer Price Index showed a drop of -0.1%, versus expectations of no change. Ex-energy and food core CPI gained +0.12%, which was just a few hundredths over the forecasted increase of +0.1%. The headline number was largely affected by an almost-2% drop in energy prices, while the core figure was affected by a -3% drop in away-from-home lodging, which subtracted a few basis points from the final figure. Apparel prices also fell, but this isn’t unusual month-to-month and could be holiday-related. Year-over-year, the headline and core inflation measures gained +1.0% and +1.7%, respectively, which, of course, are well under the Fed’s stated target of 2%-plus.
(0) Like the CPI, the Producer Price Index showed a headline monthly drop of -0.2%, which was spot on with forecast. The core PPI figure, which removes the energy and food components, rose six hundredths above forecast at +0.16%—the difference between the two being a -4% dip in gasoline over the month. Year-over-year, the headline and core have risen +0.3% and +1.4% respectively, which is a bit tamer than CPI.
If one were looking for a primary reason why the Fed is keeping the ‘pedal to the metal,’ so-to-speak, this is it—as we’ve discussed during prior weekly reviews. The risk of too little inflation, or worse, a slip into deflation, appears top of mind.
(0) The NAHB Housing Market Index for November came in at 54, which was a point lower than expected and unchanged from October’s revised figure. It was a relatively boring report. Current sales were unchanged from the prior month, and expectations for future sales and prospective buyer traffic ticked down a point. At the same time, the number of respondents in the survey this last month increased dramatically, which could have easily affected the final results (although apparently not by much). The index is almost ten points higher than it was a year ago, but has softened since summer much like other housing measures.
(-) Existing home sales came in at 5.12 million units for October, which fell short of the 5.14 million expected—a monthly decline of -3.2% versus -2.9% as implied from the expected number and represented the lowest level since June. It wasn’t a surprise considering the stacked-up trend of pending sales weakness over the last several months. Sales of single-family units fell just over -4%, which was partially offset by a +3.3% gain in condos/co-ops. Year-over-year, the series is still up +6%. Months supply remains at about 5 months.
Another housing stat that isn’t always discussed frequently is affordability. Housing affordability is measured by the National Association of Realtors, who establish a base value of 100 for a level that implies several things: that the median U.S. home, using prevailing mortgage rates and a standard 20% down payment, is affordable for a family earning the median U.S. income. Therefore, index values over 100 imply better affordability, while numbers below 100 indicate less affordable conditions. Naturally, movement in any of these variables can affect the result, but usually house prices and, particularly, interest rates move a lot faster than do median household incomes. Low interest rates have certainly been a tailwind in the cycle; recently, though, incomes haven’t kept up with house prices and that’s been a headwind.
Although the index only began in 1986, the late 1990’s are often looked at as a period of ‘normal’ housing market conditions. For the third quarter, the index fell from 178 to 161, which implies housing is cheaper than what is implied by the baseline as well as by its historical average (which happens to be 135 or so). Then again, these types of things have to be looked at a bit skeptically, as the data history isn’t that long. Tracked separately from the headline figure, the first-time buyers index has also moved to an above-100 level, which is also the highest it’s been in some time.
(+) The September Job Openings and Labor Turnover Survey (JOLTS) showed a larger number of job openings than expected, at 3,913k vs. a forecasted number of 3,850k, which is a new post-recession high point. Additionally, the hiring rate ticked up by a tenth to 3.4%—notably in professional/business services as well as leisure/hospitality—although it’s still low on a relative level compared to past cycles. The layoff/discharge rate also rose a tick, but the total separation rate and quit rate were unchanged. The level of job openings remains high relative to the unemployment rate, which is another item likely weighing on the FOMC.
(0) The employment cost index rose +0.4% for the third quarter, which was just a tenth of a percent below forecast. Wages rose +0.3%, while benefits increased +0.7%—in keeping with the longer-term trend of higher health care premiums. Over the past year, compensation costs rose +1.9%—with higher gains for management/professional jobs than for lower-end service positions. This is more of an arcane measure, but we watch it due to the tendency for wages to act as a catalyst or to coincide with broader inflation. In the last business cycle expansion, costs rose 3-4%, so we remain substantially below that and in line with overall weak employment growth in general compared to where we’ve been in the past at similar stages of recovery.
(+) Initial jobless claims for the Nov. 16 ending week fell to 323k, from a revised 339k the prior week, and better than the 335k estimate. Continuing claims for the Nov. 9 week came in close to unchanged at 2,876k, and a bit higher than the 2,870k expected.
(0) The FOMC statement from October’s meeting didn’t really offer us much of a surprise. Most importantly, the start of the tapering process is seen as ‘appropriate’ by members, at least compared to an open-ended blank check. This should be somewhat reassuring to taxpayers and free market theorists, although markets in the short-term are hesitant of the ‘free money’ disappearing.
Several economic departments track the probability distributions of when tapering is likely to happen, as well as the date of the expected first rate hike after that. Right now, the general consensus has moved from Dec./Jan. out to March, while the timing of the first rate hike has been set at late 2015 to early 2016 (the rate hike component hasn’t changed much). FOMC participants continue to seem more interested in lowering the unemployment rate threshold than they are in raising inflation targets. They also show a preference toward tapering both Treasury and MBS purchases equally than they do keeping the ‘gas’ on MBS buys (which would seem to aid housing markets more directly), although this decision was less clear.
While the average economic department has the same chance of being wrong as everyone else, this data is informative due to the amount of money these firms ‘influence,’ which naturally trickles down to their written opinions and firm trading activity. December hasn’t been ruled out, though, as a potential taper start date—the next FOMC meeting concludes Dec. 18, so that will again be a closely-watched affair. Overall, there still seems to a lack of conviction on how the taper will take place, when it will take place, how much it will be and what rules will be used in determining these thresholds. This ‘confusion’ has been specifically noted by several strategists, as the Fed’s ‘forward guidance’ language appears to be relied upon to a greater degree than actions (of which there have been few lately).
In other matters, the FOMC also voted to convert the standing temporary central bank liquidity swap facilities into a permanent program—the banks involved are Canada, U.K., Europe, Japan and Switzerland. While minor in notation, this is somewhat significant in acknowledging the increasingly ‘global’ role the Fed finds itself in.
| Period ending 11/22/2013 |
1 Week (%) |
YTD (%) |
| DJIA |
0.71 |
25.40 |
| S&P 500 |
0.41 |
28.99 |
| Russell 2000 |
0.79 |
33.95 |
| MSCI-EAFE |
-0.01 |
19.98 |
| MSCI-EM |
0.40 |
-4.36 |
| BarCap U.S. Aggregate |
-0.06 |
-1.53 |
| U.S. Treasury Yields |
3 Mo. |
2 Yr. |
5 Yr. |
10 Yr. |
30 Yr. |
| 12/31/2012 |
0.05 |
0.25 |
0.72 |
1.78 |
2.95 |
| 11/15/2013 |
0.08 |
0.31 |
1.36 |
2.71 |
3.80 |
| 11/22/2013 |
0.07 |
0.31 |
1.37 |
2.75 |
3.84 |

