
The biggest news of the week was the FOMC meeting, press release and news conference, but we won’t rehash our earlier note of the week. Long-story short, the ‘taper’ is postponed for now, and that drove sentiment (up) much more than did the underlying economic data last week. Since most market participants appeared to be prepared for the taper, it is again a reminder that markets react most convincingly to surprises and resolution to the previously unknown.
(0) The consumer price index for August rose +0.1%, about half of the expected increase (bringing year-over-year inflation to +1.5%). Stripping out food and energy, core CPI gained +0.13% compared to an anticipated +0.2% (12-month gain of +1.8%). The amounts are so small these days that they’re practically quoted in hundredths of a percent. From an individual component level, airline prices fell -3% for the month, while medical services increased about a percent, and rent of primary residence gained just under a half-percent. However, changes overall were fairly minor
(0) Industrial production for August gained +0.4%, which was just a tick below consensus, and July’s figure was revised downward by a few tenths. Manufacturing production, which is the bulk of the number, rose +0.7% on the back of stronger auto and auto parts production during the month. Auto assemblies have jumped to a post-recession high. Capacity utilization came in at 77.8%, which also underwhelmed expectations by a similar tick.
(-) The Empire manufacturing index for the New York Fed region came in at +6.3 for September—below August’s +8.2 and an anticipated +9.1 result. The underlying components were mixed, with improvements in shipments and new orders, as well as expectations for business condition improvement going out six months, but a deterioration in employment.
(+) The Philly Fed index, by contrast, rose to its highest level in 2 ½ years to +22.3 compared an expected +10.3 reading. Similarly to the Empire, new orders and shipments rose but employment also improved. Expectations looking out six months were better here, too.
(+) Existing home sales for August again rose +1.7%, which was a pleasant surprise over the forecasted -2.6% drop after a big July reading. Single-family and co-op/condo sales posted nearly similar results, so no story here. The months’ supply of homes ticked down a bit to 4.9.
(0) The NAHB housing market index for September came in unchanged from the prior month at 58, which was in line with expectations. Builder assessments of current conditions were also unchanged, prospective buyer traffic ticked up, while expectations for forward-looking future conditions deteriorated slightly.
(-) Housing starts came in weaker than expected, gaining +0.9% for August compared to a consensus of +2.3%. The always-interesting multi-family segment was responsible for the drop (down -11%), while single-family was up +7% to partially offset this, at a five-month high. Building permits were also weaker, falling -3.8% month-over-month compared to a forecasted -0.4% decline, with characteristics similar to the starts numbers—lower multi-family and much stronger single-family (a post-recession high in fact, for the latter).
Despite the leveling off in recent months, general housing numbers have shown a solid year-over-year growth trend. While the strong upward pace seen earlier in the year was probably not sustainable (and wasn’t), continued housing improvement appears more likely than not due to demographic tailwinds (we need more housing to keep up with population growth). While pricing and sales levels are back up towards more normal levels, construction remains about 40% below long-term ‘normal.’ However, despite some debate over the topic, it seems higher mortgage rates over the past few months may have contributed to some of this tempering. While this doesn’t seem like a lot in percentage rate terms, as rates are generally low versus history, a few hundred dollars a month in a mortgage payment represents a significant amount for most Americans. The Fed was likely focused on this in their decision to hold off on the taper, and even made mention of it in their statement.
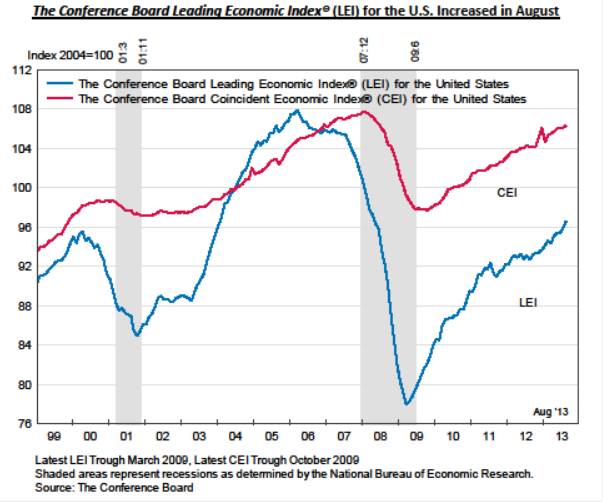
(+) The Conference Board’s index of leading economic indicators increased +0.7% in August, which indicates some momentum compared to a slightly lower gain in July and flat reading in June. Gains were largely driven by improvements in the interest rate spread, ISM new orders, workweek length and unemployment claims; while building permits and stock prices detracted. Also tracked by the Board, the index of coincident and lagging economic indicators, rose +0.2% and +0.3% for Aug., respectively.
(0) Initial jobless claims for the Sept. 14 week came in at 309k, which was far below consensus expectations for 330k. However, it was too good to be true yet again, as the second week in a row of claims reporting distortions convoluted the numbers due to state system upgrades. Since California was one of the states behind the problem, the room for error could be significant. Continuing claims for the Sept. 7 week came in at 2,787k, which were also lower than the 2,900k expected. However, due to the missing data, the entire report should probably be disregarded for now.
Lastly, as we enter the end of September, we’re approaching the Federal fiscal deadline… so expect contentious battles in Congress regarding the new budget and raising of the debt limit. Based on past experience over the last few years, we may be in for some volatility (although we’ll make the leap that leaders have the common sense to avoid conditions for an outright U.S. debt default). On the positive side of this, our fiscal situation (deficit) has improved, through better economic growth (leading to better tax receipts) and the tempered effects of sequestration (despite the horrible environment it was supposed to create).
And truly lastly, upcoming German elections on Sunday could have been a potential source of volatility—but only if things didn’t go as expected (Merkel being elected to a third term, which she was). She has been supportive of Eurozone efforts to sustain the union, but German citizens appear continually uneasy about their economic leadership role in the region and have been openly skeptical about bailing out their Southern European neighbors. She has balanced these concerns so far, and kept the confidence of the electorate.
| Period ending 9/20/2013 |
1 Week (%) |
YTD (%) |
| DJIA |
0.50 |
20.13 |
| S&P 500 |
1.32 |
21.76 |
| Russell 2000 |
1.81 |
27.49 |
| MSCI-EAFE |
2.81 |
17.12 |
| MSCI-EM |
2.67 |
-3.98 |
| BarCap U.S. Aggregate |
0.98 |
-2.39 |
| U.S. Treasury Yields |
3 Mo. |
2 Yr. |
5 Yr. |
10 Yr. |
30 Yr. |
| 12/31/2012 |
0.05 |
0.25 |
0.72 |
1.78 |
2.95 |
| 9/13/2013 |
0.01 |
0.45 |
1.71 |
2.90 |
3.84 |
| 9/20/2013 |
0.01 |
0.34 |
1.50 |
2.75 |
3.77 |

