
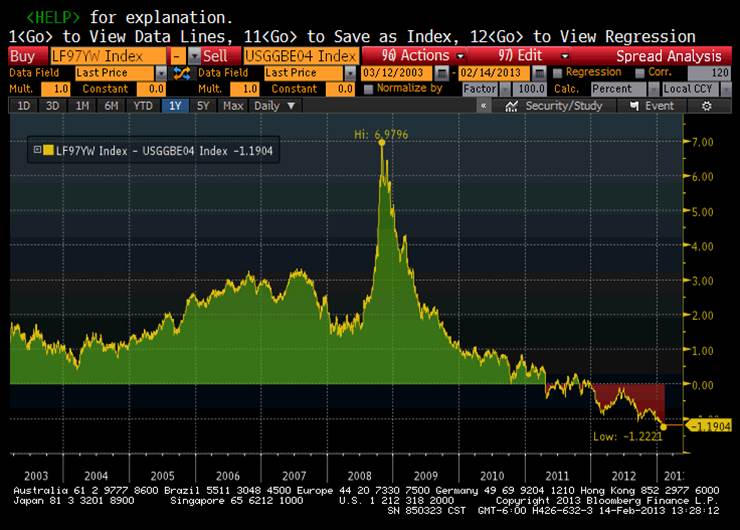
The chart of the week looks at the Yield on the Barclays Intermediate US Government/Credit Index, which is our Fixed Income Benchmark and a good proxy for a conservative bond allocation (60% Treasuries/40% Investment grade corporates) minus the 4 Year Market Implied Inflation rate (subtracting 4 year TIPS yields from 4 year Treasuries yields). The reason we use the 4 year inflation rate is because the weighted average maturity in the Barclays Intermediate US Government/Credit index is 4.18 years, so it is an apples to apples comparison to the 4 year implied inflation rate.
This basically gives you the “real yield” (i.e. after inflation) you can expect from this conservative bond index. As you can see from the chart, the real yield now stands at negative 1.2% and is at the lowest level in 10 years (as far back as our TIPS data goes). This means an investor in a conservative bond portfolio can expect to lose 1.2% of their purchasing power every year on the bond portion of their portfolio if inflation turns out to be 2.4%/year, which is currently implied by the market over the next 4 years:

