
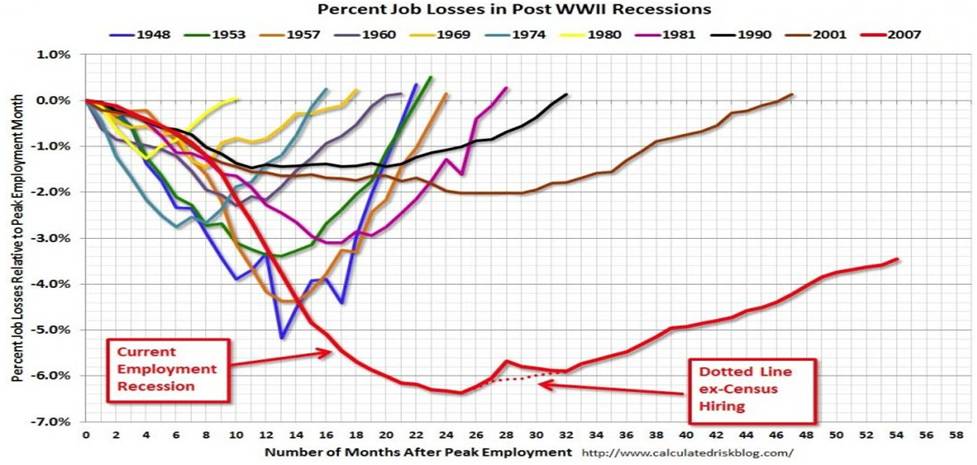
The chart of the week looks at the depth of unemployment post WWII and the time it takes to recover. There are many people talking about the current recovery that is taking place and the positive fundamental shift that is improving the US economy.
That said: December and the unemployment rate ticked up in 7.8 percent.
Although the numbers were in line with economists’ expectations, they still reflect a job market that remains incredibly weak almost four years into the economic recovery and is painting a picture of a continued slow recovery from the 2008 recession.


Great chart — really tells the story. Thanks.
This is an awesome, useful little snippet for advisors. Digestible, they can easily use as a talking point today. I think this type of thing will expand your range of followers. Will be interesting to see.
Tammy Breitenbach President Catalyst Partners, Inc. Ph. (816) 726-0579 tlb@globalcatalystpartners.com
Please remind me (again), do you have to be an LSA subscriber (user) to follow LSA connect? I keep thinking this is the “open version” to encourage interest. Then I saw the “for LSA subscribers” in top right corner.
Do you want more followers outside the circle? Was thinking through strategy. If so, do you think the “for LSA subscribers” would discourage anyone to follow? or be confusing? Maybe not, maybe moot. Maybe I’m overthinking it. Maybe not. Do you mean LSA Connect Subscribers? No huge deal, was just wondering.
Tammy Breitenbach President Catalyst Partners, Inc. Ph. (816) 726-0579 tlb@globalcatalystpartners.com