
(-) Existing home sales for December fell by -1.0%, which ran contrary to an expected +1.2% gain, and obviously was a bit of a disappointment. Single family home sales dropped by -1.4%, which were offset somewhat by condo sales, which gained +1.7%. From a regional level, weakness in the Midwest (nearly -6%) and South overwhelmed gains in the Northeast and Western portions of the country. Net-net, a choppy report, but not entirely surprisingly considering the time of year we’re in.
(0) The FHFA home price index, that takes into account prices of homes with Fannie Mae/Freddie Mac mortgages, gained +0.6% for November, which just fell short of consensus by a tenth of a percent. The Pacific and Mountain regions experienced gains near two percent, and drove the broader upward movement. The more critical measure, year-over-year price movement, registered a gain of +5.6%, making 2012 the first positive year in six years.
(-) New home sales for December were lower than expected in December, falling -7.3% month-over-month, which ran counter to an expected consensus gain of +2.1%. Some of this difference was due to some revisions for November (the gain for which was boosted from +4.5% to over +9%), but the volatility is typical of this series and this time of year. Year-over-year, sales are up +9%, which is positive.
The new home sales story has been a positive one, and may very well contribute meaningfully to U.S. GDP in 2013—inching further towards normal after plodding along at very low levels for years coincident with the financial crisis. In fact, it could add up to a large percentage of the total GPP number—which, in the slow growth period we’re in, is meaningful. There are other effects as well, such as indirect demand for household goods and a general improvement in the ‘wealth effect’ that helps consumers feel richer and better able to spend (since their homes are worth more).
(-) The Richmond Fed manufacturing index fell to a -12 for January from a positive +5 in December. The report showed general weakness in all areas, including shipments, orders and capacity utilization, as well as employment and workweek length. However, prices paid/received continued at moderate levels, reflecting the tempered inflation environment. Sentiment from survey participants about look-ahead conditions also improved a bit from lower levels pre-fiscal cliff concerns at year-end, which was a bright spot in the result.
(+) Initial jobless claims came in much lower than expected for the Jan. 19 ending week at 330k, which was far below the 355k expected. However, this may be at least partially due to a continued anomaly as a result of year-end ‘distortions’ and other seasonal adjustment factors, according to the DOL. (Their commentary is typically a bit vague, but this is the time of year when hiring/firing activity accelerates, so figures are a little fuzzy.) Continuing claims for the Jan. 12 week came in at 3,157k, which was a bit lower than the 3,200k expected. Note that, due to the holidays, claims for nine states were calculated using estimated data, which corrupts the results somewhat. Nonetheless, the trend for both series has been moving lower—a positive sign for the job market.
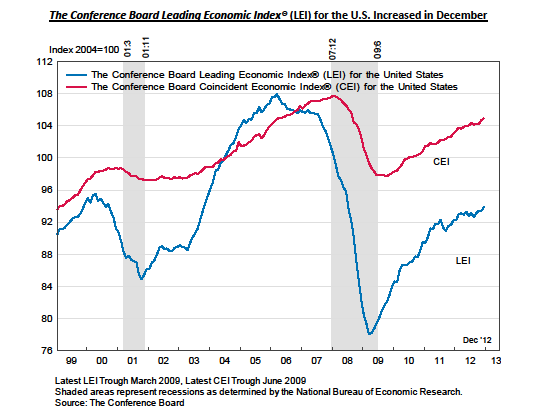
(+) The Conference Board’s indexes of economic indicators were released for December, with less fanfare these days it seems. The leading economic index rose 0.5% to 93.9, which was an improvement on an unchanged reading from the month prior. Results were led by better numbers in employment claims, building permits and credit (two-thirds of all indicators were positive), while consumer expectations and manufacturing new orders remained weak. The coincident and lagging indicators also rose over the month. The leading index certainly picked up speed over the second half of 2012 compared to a slower increase during the first half. The longer-term trendline has moved in an upward trajectory since the financial crisis—as seen in the chart below.
The Bank of Japan this week further expanded their inflation target from 1% to 2%, in line with efforts to expand their economy and recent political rhetoric. For a sense of perspective, their core CPI over the past twelve months is currently -0.6%, which is certainly deflationary as opposed to inflationary, and problematic from the perspective of growth generations prospects. So, this is where the new inflation target originated from. So far, markets believe it, and the Yen has fallen almost 10% against the dollar in the past month, and Nikkei stock index is up just over 10% as tougher language and an asset-purchase program (like ours) has been announced. However, the last time inflation has reached the 2% level in Japan on a year-over-year basis was 1997—this may be a long road.
| Period ending 1/25/2013 |
1 Week (%) |
YTD (%) |
| DJIA |
1.80 |
6.17 |
| S&P 500 |
1.15 |
5.48 |
| Russell 2000 |
1.40 |
6.61 |
| MSCI-EAFE |
1.56 |
4.81 |
| MSCI-EM |
-1.08 |
1.32 |
| BarCap U.S. Aggregate |
-0.38 |
-0.61 |
| U.S. Treasury Yields |
3 Mo. |
2 Yr. |
5 Yr. |
10 Yr. |
30 Yr. |
| 12/31/2012 |
0.05 |
0.25 |
0.72 |
1.78 |
2.95 |
| 1/18/2013 |
0.08 |
0.26 |
0.77 |
1.87 |
3.03 |
| 1/25/2013 |
0.08 |
0.28 |
0.87 |
1.98 |
3.14 |

